Your Contact Sheet Loses Its Last Row: Build the Grid From the Full Image Count
The five-image fixture needs two rows on a three-column sheet. Round the row count up before allocating the canvas, and keep the placement coordinates tied
Read the missing row from its coordinates
The broken sheet is 224 pixels wide and 84 pixels high. The loop still returns five placements. Those two facts explain why counting placement records alone gives a misleading result. For this five-image fixture, the placement list records work the loop attempted, even when part of a rectangle falls outside the image. Treat the canvas and the placement records as two views of the same operation and check that they agree.
The inputs are indexed from 0. Index 3 starts at y = 104 and is 16 pixels high, so it falls entirely below the baseline. Index 4 starts at y = 80 and is 64 pixels high. It intersects the canvas in rows 80 through 83, leaving a four-pixel strip. The baseline image has valid y coordinates from 0 through 83. A placement whose bottom edge is exactly 84 would fit, because its last row would be 83.
Trace the original inputs before fitting them into cells. Their dimensions, in order, are 80 by 40, 40 by 80, 40 by 40, 80 by 20, and 20 by 80 pixels. All five are solid RGB images made in memory. The 64 by 64 cell reserves a square for each one. The picture inside that square can be shorter or narrower, so two images in the same grid row can have different top coordinates. That difference is why one image vanishes and the other shows a strip.
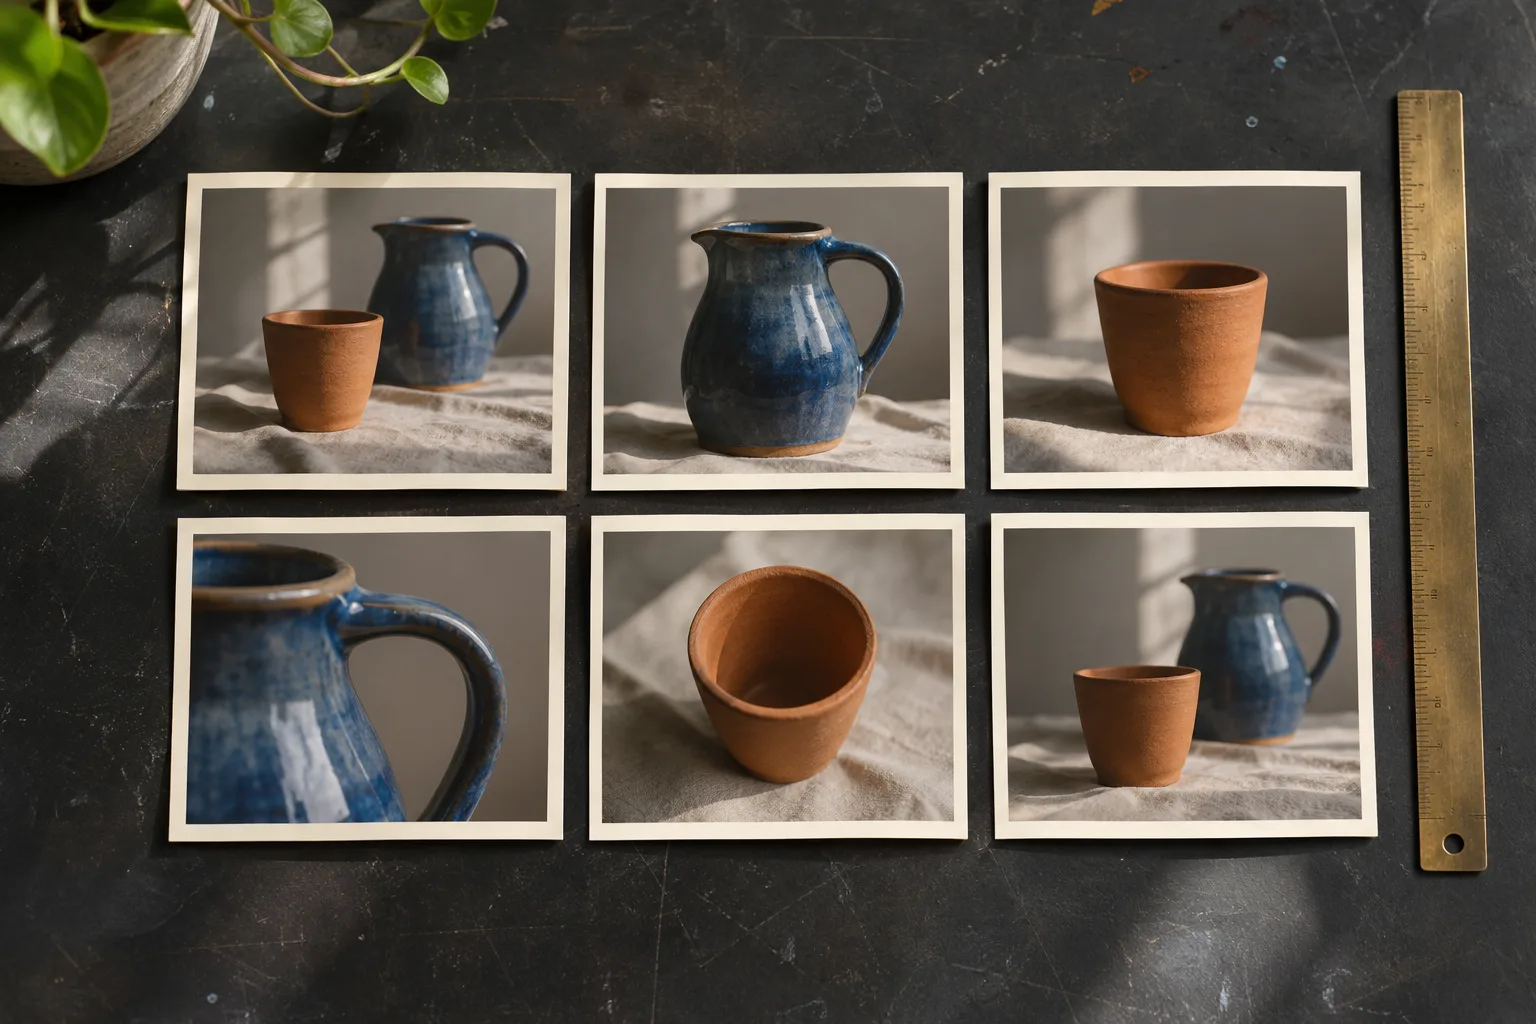
The corrected canvas is 224 by 154 pixels. It extends below the largest lower edge in the second row and leaves the intended bottom margin. You can compare the two retained PNGs, broken-grid.png and complete-grid.png, while reading the recorded placement dictionaries. They are files from the synthetic experiment. The lead photograph illustrates a physical proof layout with six prints, so it serves a different role from those two artifacts.
ImageOps.contain resizes an image to fit within the requested bounds while preserving its aspect ratio. Pillow ImageOps reference
Reproduce the clipped sheet with the five fixtures
To reproduce the symptom, create the five image objects in the fixture order, then pass that list to broken_sheet and make_sheet. Both functions use the same rendering loop. The last argument they pass to the shared helper changes the calculation that decides how many rows to allocate. The first version uses floor division. The corrected version includes any partially occupied row. Keep the images, spacing, and column count fixed between calls so the outputs isolate the effect of that decision.
The geometry changes at the first index whose integer row number is 1. For three columns, that is index 3. In the broken version, the declared grid only has row 0, even though the loop computes positions for row 1. This is a useful debugging pattern for similar layouts. Compare the number of rows your allocator reserves with the largest row number the placement calculation can produce. On a zero-based grid, the latter is one less than the number of required rows.
If the sheet represents a sequence, decide its input order first by sorting frame filenames by their numeric parts. The renderer then follows that order and gives every input a cell.
Keep the source order stable while comparing the outputs. The fixture uses red, green, blue, yellow, and cyan so the input order can be recognized without labels. The actual order test samples the first two placements. The bound check then covers all five rectangles. Each assertion answers a separate question. A successful color check at the top of the sheet cannot establish that the lower row fits, and a correct canvas size does not establish that images were pasted in the order supplied.
When diagnosing a project, choose an input count that crosses a row boundary. With three columns, three inputs will fit the broken formula and can give a false sense of correctness. Four inputs exercise the first partially filled second row, while five inputs leave one vacant cell. Six inputs fill both rows, making the baseline formula agree with the corrected formula again. The retained experiment uses five, and the suite separately tests a single input in the corrected renderer. These additional counts are examples for adapting the test, rather than reported runs.
A project that saves only the image could expose the placement list in a development log when a proof sheet is clipped. Record the configured cell dimensions and the bounds of the rectangles, alongside the input count and the final image dimensions. Inspect the largest bottom coordinate before changing the resampling method or swapping the input photos. Cropping at a specific canvas edge is an allocation question. A blurry or overly small thumbnail inside its cell requires a different investigation.
Use a distinct color in each cell when building a diagnostic image. In the retained example, the green rectangle in the first row is easy to distinguish from the cyan rectangle below it. With five copies of the same image, a duplicated placement could look plausible. Likewise, two uniformly colored images with the same dimensions would make it harder to catch a swapped order by sampling pixels. The point of the fixture is to turn a question about visibility into a question you can answer from coordinates and recognizable content.
Keep the output files separate during a diagnosis. A project that writes the baseline and the corrected version under the same name can accidentally show the last file from disk in both comparisons. Give the output filenames different roles and record their dimensions next to them. When you inspect a very small PNG, use a view that lets you see individual rows. A thin clipped strip can disappear at a zoomed-out display size even though it is present in the underlying file.
Allocate the canvas and contain the thumbnails
Allocate the grid using the dimensions of its cells. The width is two 10-pixel margins, three 64-pixel cells, and two 6-pixel gaps. This gives 224. The corrected height uses two 64-pixel rows, one 6-pixel gap, and the two margins, giving 154. Floor division allocates a single 64-pixel row and the margins, giving 84. Since all three columns are fixed, both versions agree on the width.
The fitted image sizes in the recorded output are 64 by 32, 32 by 64, 64 by 64, 64 by 16, and 16 by 64. ImageOps.contain chooses sizes inside the cell. The square blue input is enlarged from 40 by 40 to 64 by 64 in this example. The function passes NEAREST explicitly, which is appropriate for checking the solid fixture colors. An editorial project can choose its own resampling policy and evaluate it separately on representative assets.
Position the logical cell first, then add the offset for centering the fitted image. The second row begins at 10 + 64 + 6 = 80. The fourth image is 16 pixels high, so the vertical adjustment is half of 64 minus 16, or 24. Its resulting top is 104. The fifth image is already 64 pixels high, so its top is 80. This calculation also works horizontally. Its 16-pixel width is centered in the second column, whose cell starts at x = 80, giving the recorded left coordinate of 104.
The example rounds the centering adjustment down to an integer. If the spare space is odd, one edge of a cell can have an extra pixel of padding. This is a consequence of laying out a discrete grid. A layout that needs a different alignment could deliberately put the larger share on the opposite side, or align every picture to one edge. Make the choice explicit and test one odd-sized case before relying on it in a template. The five saved placements are the measured values for this fixture.
The pale gray background uses (245, 245, 245). It shows through in the margins, gaps, unused cells, and space around a contained picture. These regions have different geometric roles even when they share a color. If you add outlines or labels, calculate their positions from the logical cell. Calculate the image bounds from the fitted rectangle. Using the thumbnail size to decide the next cell position would change the layout every time a source aspect ratio changed.
sheet_grid.py
from PIL import Image,ImageOps

def _render(images,columns,cell,gap,margin,complete):
    if type(columns) is not int or columns<1:raise ValueError('Positive integer columns required')
    if len(cell)!=2 or any(type(x) is not int or x<1 for x in cell):raise ValueError('Positive integer cell dimensions required')
    if any(type(x) is not int or x<0 for x in (gap,margin)):raise ValueError('Nonnegative integer spacing required')
    images=list(images)
    if not images:raise ValueError('At least one image required')
    rows=(len(images)+columns-1)//columns if complete else len(images)//columns
    width=2*margin+columns*cell[0]+(columns-1)*gap
    height=2*margin+rows*cell[1]+max(0,rows-1)*gap
    canvas=Image.new('RGB',(width,height),(245,245,245));placements=[]
    for index,image in enumerate(images):
        if not isinstance(image,Image.Image) or image.mode!='RGB':raise ValueError('Supply RGB image objects')
        thumb=ImageOps.contain(image,cell,method=Image.Resampling.NEAREST)
        left=margin+(index%columns)*(cell[0]+gap)+(cell[0]-thumb.width)//2
        top=margin+(index//columns)*(cell[1]+gap)+(cell[1]-thumb.height)//2
        canvas.paste(thumb,(left,top));placements.append({'index':index,'left':left,'top':top,'width':thumb.width,'height':thumb.height})
    return canvas,placements

def broken_sheet(images,columns=3,cell=(64,64),gap=6,margin=10):
    return _render(images,columns,cell,gap,margin,False)

def make_sheet(images,columns=3,cell=(64,64),gap=6,margin=10):
    return _render(images,columns,cell,gap,margin,True)
Recorded local check: Thirteen local Pillow RGB grid methods on synthetic solid-color images only. Baseline floor row count clips incomplete final row; fixed ceiling row count fits all5. Actual224x84/224×154 outputs. Nearest resampling, RGB-only contract, no alpha/EXIF/color management, real photo quality, browser/video/AI model benchmark or resource-security guard.; environment: Python 3.12.3 on Windows; Pillow 12.3.0
Verify the grid with color samples and bounds
The suite contains 13 local unittest methods. The placement test checks nonnegative left and top values and verifies that adding the width or height keeps the right and bottom edges within the canvas. The first rectangle, for example, starts at left 10 and top 26. It ends before the right edge of the first cell and before the sheet boundary. The dimension test independently checks that the corrected result is 224 by 154.
The order test samples two known positions. It reads (255, 0, 0) from the top left of the first fitted rectangle and (0, 128, 0) from the second. Because the inputs are solid, there is no ambiguity about the sample expected at those points. Those checks confirm these two fixture placements. A project with photographic inputs might instead draw small test markers or compare a known crop when checking order.
The non-square check asserts that the first fitted image measures 64 by 32. It does not sample the 16 pixels above that image. The retained placement record provides the observed top of 26. When writing your own check, keep a dimension assertion for the fitted size, then assert position separately if alignment is a requirement. A centered 64 by 32 image and a top-aligned 64 by 32 image share the same dimensions but produce visibly different sheets.
Test_sources_not_modified guarantees that input image objects remain completely unaltered during canvas generation by testing their size and byte representation before and after calling make_sheet. This immutability check prevents subtle bugs where in-place operations might corrupt source data during batch processing or multi-pass layout runs. Furthermore, edge-case tests confirm that invalid configurations such as negative gaps, zero columns, or boolean column values raise ValueError exceptions immediately rather than producing malformed outputs. Zero spacing configurations are also explicitly tested, verifying that a zero gap and zero margin yield a tightly packed 192 by 128 pixel canvas for the exact same five fixtures.
Two small parameter checks help interpret failures in an adapted copy of the example. The zero-gap and zero-margin case expects a 192 by 128 canvas. It catches a calculation that adds a gap even when no gap is configured. The one-source case expects 224 by 84, demonstrating the fixed-column policy. If you deliberately change that policy to collapse unused columns, update the expected geometry and explain the new output contract in the caller.
Choose the grid policy for a real proof sheet
Choose the meaning of a sheet before you change its width. If each sheet is a page in a review set, retaining a constant width makes images easier to compare between pages. If the sheet is a single preview for one project, you might prefer to collapse the unused columns when there are only one or two pictures. The supplied renderer retains the requested column count. A different rule should influence both the allocation and the mapping from index to cell, so the two parts continue to describe the same grid.
A fixed paper or export size calls for a page policy rather than an unbounded canvas. First determine the usable height after subtracting margins and any space for labels. Then choose how many complete rows fit at the required cell size and spacing. Split the ordered sources into pages of that many rows times the column count. Run the layout for each batch, and decide whether the final page uses the smaller fitted height or the same paper-sized backing as the others. This is a proposal for extending the example. The fixture saves only one page per render.
For a photographic proof, choose how to handle transparency before supplying RGB images to the layout. An asset with transparency may look different when flattened over gray than it does over white. Review that appearance in the intended output, then supply the converted image if you decide on an opaque background. The test with a 2 by 2 RGBA image confirms rejection in this implementation. It offers no evidence about the appearance of a particular compositing policy.
Labels and sequence markers need their own space. For instance, if each cell has a line for a source filename below the thumbnail, reserve that line inside each cell or increase the row height explicitly. Do not place text at the thumbnail bottom and expect its baseline to be consistent across landscape and portrait inputs. Define where the label sits relative to the cell, then verify the page with a mixture of shapes and long names. That extension will need font and text measurements absent from the current example.
For a sheet that will be opened on different screens, check the native output dimensions before scaling it in a viewer. A browser or design application may shrink the finished sheet to fit a panel. That can make every cell look smaller without changing a single source placement. Keeping the original PNG and a record of its dimensions allows you to distinguish viewer scaling from an actual clipping bug in the generated canvas.
Choose a thumbnail policy for each kind of review. If the sheet is for checking whether a source includes a small detail near the edge, a contained rectangle is appropriate because it preserves the full subject within the cell. If the sheet is for comparing crops destined for a fixed aspect ratio, a separate crop preview may be more informative. Both can use the same cell geometry. Give the render mode a visible label in the output so a reviewer can tell whether an object was cropped deliberately or clipped by a layout error.
A proof can represent rejected inputs explicitly if they matter to the review. Imagine a sequence in which an unreadable source should keep its original position so that a later frame does not appear to move earlier. The current renderer expects image objects. One proposed caller could create a visible placeholder for the unreadable source and still pass an object for every intended slot. Another could omit the file and store a skipped-input report. Both policies need an ordered list and a clear relationship between the source index and the output slot.
Estimate the canvas dimensions before accepting a large batch. For example, raising the cell width from 64 pixels to 512 pixels increases the pixel count across the whole sheet, even if many of the source objects are small. Extending the number of rows increases height as well. The original helper validates positive dimensions, but it has no project-specific limit for how big an output may become. A caller that handles very large jobs can decide a maximum canvas size, paginate above it, and test that policy without allocating an enormous image simply to check the limit.
Keep input selection and output rendering separate
Pass an ordered collection of Pillow image objects into make_sheet. The sample layout receives already selected objects, so it does not define which files belong in a project or how the originals should be opened. A caller may choose a set of files for review, load their contents, and pass the objects in an intentional order. If these are lazily loaded objects, keep their inputs readable until the renderer has finished or prepare independent copies beforehand.
The source-preservation test compares each original image size and byte representation before and after the render. That is narrower than proving that every object property or file attribute remains unchanged. It still covers the practical risk of resizing a source in place before it is reused in another output. When an application makes both a tight contact sheet and a larger review sheet from the same inputs, a test can compare the original dimensions and pixels again after both operations.
The helper validates numeric configuration and the presence of inputs before it allocates the canvas. It checks an individual image type and RGB mode inside the drawing loop. A rejected image can therefore occur after earlier images were drawn on the in-memory canvas, although the function returns no completed sheet in that case. If your application needs to report every invalid input at once, inspect them in the caller and collect a separate inventory before rendering. This example raises on the first invalid object it reaches.
A file writer is another separate step. For a review workflow, record which version of the input list and which layout settings produced each exported proof. If the input set changes during a later run, the saved dimensions and placement records help you compare the two outputs. When investigating a missing item, start with its index in the ordered list. Then check the recorded rectangle against the exact output canvas. That gives you evidence about whether the item was excluded before layout or clipped during it.
A placement dictionary identifies an index rather than a filename. If the proof is part of a review tool, keep the corresponding ordered input list together with the placements. Two inputs can have the same displayed filename, particularly if they come from different folders. A project identifier or a path relative to the project can preserve the association without printing a private absolute path on the sheet. The small fixture has only one array of images, so its indices are sufficient.
Make rerenders easy to compare by changing one layout choice at a time. For example, when evaluating wider margins, keep the selected input order, cell size, and gap unchanged. Compare the two dimensions, then compare one known placement and inspect the last row. A test that changes margins, columns, and resampling together can tell you the output differs but leaves several explanations for the difference. The original baseline isolates row allocation. Apply the same isolation when adding a new layout choice.
Prepared with AI assistance and automated review. The original code was tested locally. The lead photograph illustrates the subject.